9. For loops#
We will now explore one of the main strengths of programming: automating repetitive tasks with loops!
Here we’re going to look at a specific type of loop called a for loop, which is used when you know how many times you want to repeat an action.
Summary of commands#
In Python, the general structure of a for loop is like this:
for i in collection:
    <do something repeatedly, where each iteration, the variable i takes on a different value in the collection>
where collection is usually a list-like object of values.
The for loop stops when all the items in the collection are used once.
A very common expression you’ll see for collection is range(N), which is a built-in function that enumerates numbers from 0 up to N (not inclusive).
The full function is range(start, stop, step).
Part 1#
Compute \(10!\) (ten factorial). That is, the product of all the integers from \(1\) to \(10\).
product = 1
for i in range(1, 11):    # we specify the start, because we don't want to include 0!
    product *= i          # shorthand notation for self-multiplication
print(product)
3628800
Part 2#
Compute the sum of all even numbers from \(0\) to \(100\).
Note: There are multiple ways to approach this!
In Python, the modulo operator
%, used asa % b, returns the remainder when \(a\) is divided by \(b\).You can change the
stepsize in therange()function.
# using the modulo operator
running_sum = 0
for i in range(101):
    if i % 2 == 0:
        running_sum += i
print(running_sum)

# using the step parameter
running_sum2 = 0
for i in range(0, 101, 2):
    running_sum2 += i
print(running_sum2)
2550
2550
Part 3#
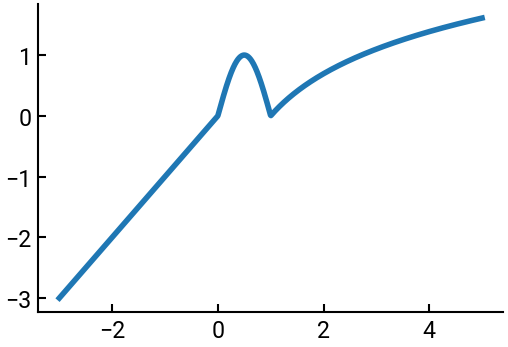
Define the following piecewise function between \(x = -3\) and \(x = 5\) using \(1000\) points and plot it.
import numpy as np
import matplotlib.pyplot as plt

# define x vector
x = np.linspace(-3, 5, 1000)

# define an empty y vector of the same length
y = np.zeros(x.shape)

# loop through the indices
for i in range(len(x)):
    if x[i] < 0:
        y[i] = x[i]
    elif x[i] <= 1:
        y[i] = np.sin(np.pi * x[i])
    else:
        y[i] = np.log(x[i])

""" alternative way to loop
for i,xx in enumerate(x):    # return the index,value of each element in x
    if xx < 0:
        y[i] = xx
    elif xx <= 1:
        y[i] = np.sin(np.pi * xx)
    else:
        y[i] = np.log(xx)
"""

# plot y as a function of x
fig, ax = plt.subplots()
ax.plot(x, y)
plt.show()