18. Finding minima of functions#
At this point you’re quite skilled at finding local minima of functions analytically, so now we’ll explore how to do so numerically.
Summary of commands#
In this exercise, we will demonstrate the following:
scipy.optimize.fmin(func, x0)- Minimize a functionfuncgiven an initial guessx0.
This is part of the SciPy package, which we have yet to see in this class! Whereas NumPy provides the foundational array structure, SciPy contains a lot of helpful routines that operate on such structures, such as optimization, statistics, integration, etc.
Part (a) - Functions of a single variable#
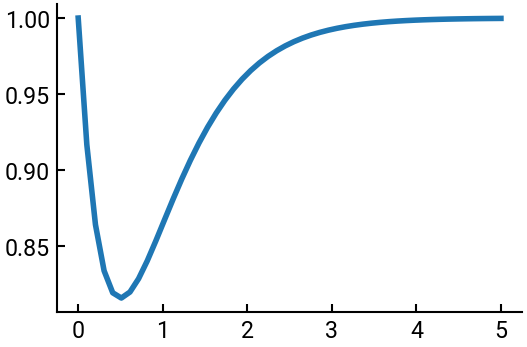
Find the minimum of the function \(f(x) = 1 - xe^{-2x}\), first analytically and then numerically.
The analytical derivative is
The numerical solution is interesting.
You’ll notice the function signature is fmin(func, x0), where:
x0is your initial guess, one for each variable.funcis an actual function (“callable”), not simply an array of numbers! This means we need to define a new function that returns the appropriate computation on \(x\). In Python, the syntax for defining your own function is:
def my_func_name(arg1, arg2, ...):
    """ optional docstring to explain purpose, arguments, etc. """
    do something
    return something   # optional
The
defat the start is required, as is the colon at the end of the first line.Just like variables, function names should be descriptive.
Arguments are optional.
Docstrings are optional but very nice to have (for others and future you). No need though if the function is very simple.
Returning a value is generally optional, but here we want to return the expression for the analytical function.
from scipy.optimize import fmin    # take note of syntax when importing specific functions!
import numpy as np
import matplotlib.pyplot as plt

def my_function(x):
    return 1 - x * np.exp(-2 * x)  # that's it!

minimum = fmin(my_function, 0)     # initial guess of 0
display(minimum)                   # many attributes!

# plot it for good measure
x = np.linspace(0, 5)
fig, ax = plt.subplots()
ax.plot(x, my_function(x))
plt.show()
Optimization terminated successfully.
         Current function value: 0.816060
         Iterations: 23
         Function evaluations: 46
array([0.5])

Part (b) - Functions of several variables#
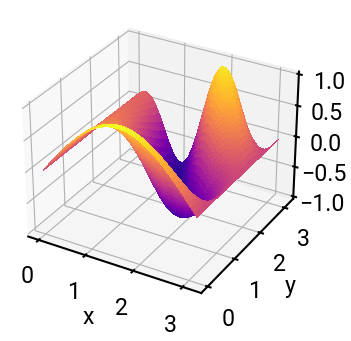
Find the minimum of the function \(f(x,y) = \cos(xy) \sin(x)\) over the domain \(0 < x < \pi\), \(0 < y < \pi\). Start by plotting the function to approximately locate the minimum and use these approximate values as your initial guess.
Important
fmin() can be kinda quirky.
If you have two variables x and y, instead of inputting them as separate arguments, instead group them into a list, i.e., u = [x, y].
Then your x0 will be a list as well for the initial guesses.
# define the function - note the grouping of x,y into a list u
def new_func(u):
    return np.cos(u[0] * u[1]) * np.sin(u[0])

# plot it
x = np.linspace(0, np.pi)
X, Y = np.meshgrid(x, x)
Z = new_func([X, Y])

fig = plt.figure()
ax = fig.add_subplot(projection='3d')
ax.plot_surface(X, Y, Z, cmap='plasma', antialiased=False)
ax.set(xlabel='x', ylabel='y')
plt.show()

# minimum appears to be near (1.5, 2)
minimum = fmin(new_func, [1.5, 2])
display(minimum)
Optimization terminated successfully.
         Current function value: -1.000000
         Iterations: 25
         Function evaluations: 49
array([1.5708235 , 1.99997996])

