20. Vectors of random numbers#
Randomness occurs all the time in engineering (chance, sampling, errors, etc.), so it’s important that we are able to model it and visualize the results of random processes.
Summary of commands#
In this exercise, we will demonstrate the following:
np.random.default_rng()- Object for generating random values. This is the preferred way to generate random numbers in Python.Optional
seedparameter for reproducibility.
rng.normal(loc, scale, size)- Drawsizerandom numbers from a normal distribution with meanlocand standard deviationscale.ax.hist(x, bins)- Create a frequency plot (histogram) of values inxusingbinsnumber of bins (optional).
Manufacturing uncertainty#
At the assembly line of a big aircraft company, bolts are stored in boxes containing \(1000\) parts each. The bolts are supposed to have a nominal diameter of \(5\) mm. But due to the uncertainty in the manufacturing process, some turn out to be larger and some turn out to be smaller than nominal.
Part (a)#
Create a random vector whose components are the diameters of each bolt in a box.
Hints:
rng.normal()is centered atloc(default: \(\mu = 0\)) andscale(default: \(\sigma = 1\)). You can scale both as needed.It can draw \(M \times N\) random numbers, as specified by
size.\(\sigma\) is related to the uncertainty in the diameter of the bolts. Here, \(\sigma = 0.25\) mm. This means that about \(67\%\) of the bolts have diameters within \(0.25\) mm of the nominal diameter.
\(\mu\) is the nominal diameter of the bolts. Here, \(\mu = 5\) mm.
import numpy as np

# constants
sigma = 0.25
mu = 5
N = 1000

# sampling
rng = np.random.default_rng(seed=1)    # construct an object to call; seed for consistency
x = rng.normal(loc=mu, scale=sigma, size=N)
Part (b)#
Plot a histogram showing the number of bolts as a function of their diameter.
import matplotlib.pyplot as plt
fig, ax = plt.subplots()
ax.hist(x, 30)
ax.set(xlabel="Diameter (mm)", ylabel="Number of bolts")
plt.show()
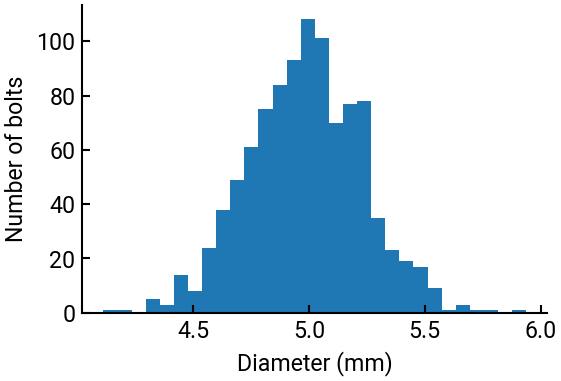
Hint
The ax.hist() command takes the vector generated by the rng.normal() command as input and counts the number of bolts having a diameter within a certain range (a bin).
The number of bins is defined by the second parameter, and it is somewhat of an art to choose the “correct” bin size for the plot to look nice.