7. How to use a script#
In this exercise, we’ll cover some more best practices in coding in Jupyter notebooks:
Reset and run all: If your variables ever get confusing, just reset the runtime using the menu options and start from the top. You can also try adding a
%reset fcommand at the top of the first code cell to explicitly clear all variables and imported packages.Comments are your friend! Use the
#symbol to start an in-line comment.Protip: If you ever forget what a function accepts as arguments, start typing
func_name(and then after the open parentheses, hit Shift+Tab and the docstring should pop up! This can save some time from searching it up.
Making more plots#
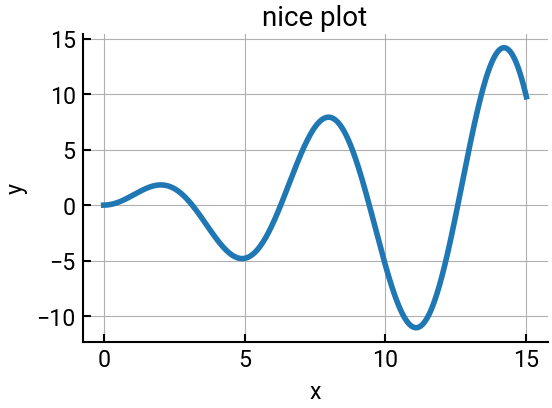
We will plot the function \(y = x \sin x\) between \(0\) and \(15\) using \(1000\) points, including labels and a title. Remember this will require the use of NumPy and Matplotlib, both of which must be imported.
# reset namespace - usually just "Reset and Run All" from the menu
%reset -f

# import packages with aliases
import numpy as np
import matplotlib.pyplot as plt

# define the function
x = np.linspace(0, 15, 1000)
y = x * np.sin(x)

# make the plot
fig, ax = plt.subplots()
ax.plot(x, y)
ax.set(title="nice plot", xlabel="x", ylabel="y")
ax.grid('on')   # generally we don't need gridlines, but we do this to show it
plt.show()
What if you wanted to use an actual script?#
Well, it’s hard to demo through Jupyter Lab or Google Colab, but you could copy the code that you wrote above, paste it into a Python file (my_script.py, for example), and then in your local interpreter, execute:
python my_script.py
and something fairly similar should result.
This would be equivalent to executing .m script files in MATLAB.