21. More random numbers#
Here is another example of using random numbers to model a problem and visualizing results on a stem plot.
Summary of commands#
In this exercise, we will demonstrate the following:
np.mean(x)- Compute the mean of the elements ofx.ax.stem(x)- Create a stem plot of the elements ofx.Returns three objects corresponding to the markerline, stemlines, and baseline.
Traffic fines#
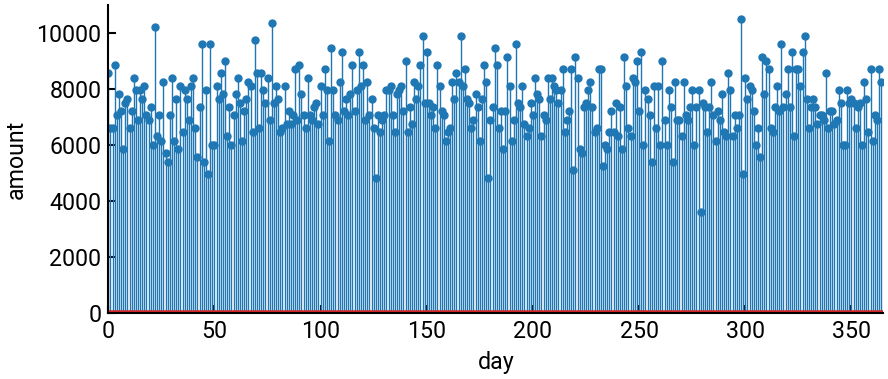
Highway patrol uses a radar to measure the speed of the cars on a freeway. The speed limit is \(55\) mph. The officers pull over all cars whose speed is greater than \(80\) mph and write a ticket for \(\$150\) each. If \(8000\) vehicles are observed on the highway each day, on the average, how much money does the highway patrol collect each day? Compute the average over one full year and make a stem plot of the amount per day. Assume \(\sigma = 10\).
import numpy as np
import matplotlib.pyplot as plt

# constants
sigma = 10
limit = 55
thresh = 80
ticket = 150
N = 8000
days = 365
daily_totals = []

# sampling
rng = np.random.default_rng(seed=1)    # construct a rng with seed
for i in range(days):
    x = rng.normal(loc=limit, scale=sigma, size=N)
    mask = x > thresh
    daily_total = np.sum(mask) * ticket
    daily_totals.append(daily_total)

average = np.mean(daily_totals)
print(f"The highway control collects ${int(average)} each day on average.")

# make plot
fig, ax = plt.subplots(figsize=(10,4))
ml, sl, bl = ax.stem(daily_totals)    # return three objects, see documentation
ax.set(xlabel="day", ylabel="amount", xlim=(0,365), ylim=(0,11000))
ml.set_markersize(5)
sl.set_linewidth(1)
plt.show()
The highway control collects $7438 each day on average.