Lab 1: X-ray emission and absorption
Contents
Lab 1: X-ray emission and absorption
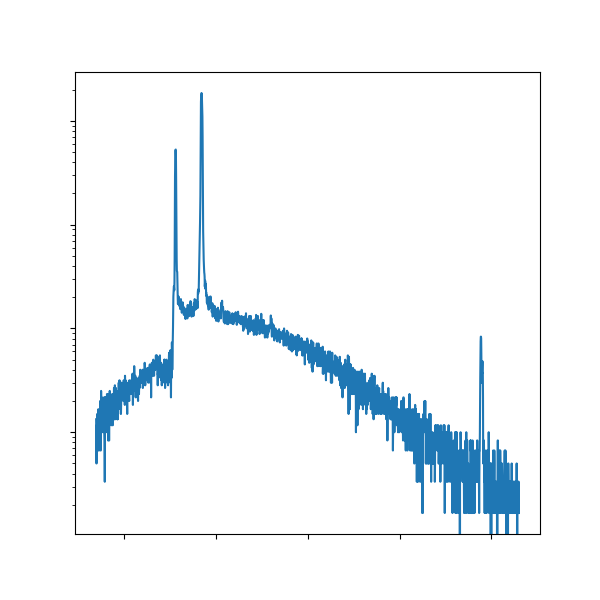
Welcome to Lab 1! For this lab, we will be writing some Python code to help analyze your X-ray emission and absorption data. Because there are a lot of spectra and plots involved in the writeup, we’ll focus this lab on data visualization in Python. Whenever we’re working with data, there exists an opportunity to tell a good story, and creating compelling visualizations (e.g., plots) is a critical component of scientific writing as visuals are what our eyes gravitate toward and what our brains remember best. Moreover, if you structure your text around the figures/tables in your report, you should find that it’s a lot easier to connect ideas in writing.
The primary outcomes of these notebooks are:
Create plots of your data with the Matplotlib library.
Apply fundamental data visualization principles to plot your data.
Tip
If you’re unfamiliar with Python and the JupyterHub interface, we’ve prepared some tutorials for you in the previous pages. Please refer to the How to use Jupyter Book and Introduction to Python notebooks for more guidance!
